Short-Term Algorithmic Parameters to Buy Stocks and ETFs with LFT Buy Program
Symbol: AAPL (for example)
Limit price: Use 5 or 15 min ATR at the beginning of trading day (look at previous days trading day or current one). If you set Limit Price too low, you will get in close to market price. Too high of a limit price and you will not get in or you will get in late.
Take Profit: Highest ATR on 15 min chart x 0.618 (or use Fibonacci)
Entry order fill wait (ms): 1,500,000 ms (15 min max)
Exit order fill wait time (ms): 4,500,000 ms (75 minutes max)
Quantity: 25-400. If you go over 400 shares, many orders will not be filled at the same price
Entry Order SMA (5s): -0.002 to -0.05 (or you choose); My recommendation is -0.002 to -0.003
Exit Order SMA (9 period SMA): 99999999 This is really just thought of as an emergency stop loss–in case trade goes against you rapidly. Recommend against using…only in LFT 1st edition.
Trailing Stop: 2 x highest ATR on 15 min chart (or use Fibonacci)
MA Crossover Entry: False
VXX, SPXU, FANG, AMZN, GUSH, DRIP stocks/etfs
These volatile stocks can be traded daily if you are intelligent and only trade if these stocks/etfs are in a sideways or in a downtrend. (I avoid shorting leveraged volatility ETFs in general due to the fact that premarket moves do not always correlate with moves after the market opens).
30 min before market opens, I look and see if major stocks are trending up or down in premarket trading.
Look also at your watchlist of popular stocks on TWS and stocks that closed lower the previous day.
Current and previous day stock movements https://www.investing.com/equities/
Premarket Stocks https://www.investing.com/equities/pre-market
See also https://www.investing.com/equities/trending-stocks
Premarket ETFs https://www.investing.com/etfs/major-etfs
_____________________________________________________
Symbol: TVIX (for example)
Limit price: 0.02 (0.01 to 0.10) This values is 1 to 10c below the market price at a given time. If you set Limit Price too low, you will get in at top of market. Too high of a limit price and you will not get in.
Take Profit: SL x 2 You may also want to use Fibonacci parameters to determine this as well or set up your own exit price based on other calculations.
Exit order fill wait time (ms): 30,000,000 milliseconds (8.3 hours) is recommended for day trading. It is recommended to avoid using this exit time to close trades because it only does stop limit orders that do not always execute or cancel out the other orders.
Entry order fill wait (ms): 8000 (7000-100000). 8000 milliseconds (aka 8 seconds) is a pretty good time for volatile stocks or etfs. For less volatile stocks, you will want a longer time period such as 100,000 milliseconds (1 min, 40 seconds)
Quantity: 100 (5-400) For many stocks/etfs, if you go over 400 shares, many orders will not be filled at the same price at same time.
Entry Order SMA (5s): 0.03 (0.02 to 0.05). This entry order is based on the slope of the simple moving average over a 5 second time period. If your stock/eft’s price is equal to or greater than the inputted value (eg 0.03) and all other parameters are met, your trade will trigger. If you decide to be conservative and only wait for the biggest bounces, set this number higher. If you feel that the trend is already established and are want to enter the trade sooner, set the number lower.
Exit Order SMA (9 period SMA): -1 (-0.8 to -2) This exit order will trigger value is based on 9 period EMA on a 5 minute chart. This is really just thought of as an emergency stop loss–in case trade goes against you rapidly. However, longer term traders may want to use the EMA9 as their primary exit. Note: If you set this number too low, you may exit the trade more rapidly than desired.
Trailing Stop: 1.2 x ATR Or use Fibonacci or other calculations to determine this value. In general, shorter term day traders use lower values for trailing stops. Longer term traders will use higher values for trailing stops.
MA Crossover Entry: True If set to “True,” this parameter will only allow trades if the EMA crosses the SMA on a 5 minute chart. If set to “False,” this parameter will allow trading if the EMA is below the SMA on a 5 minute chart. The objective is to keep traders out of a trade when no trend exists. Note: On volatile stocks/etfs that are in a sideways movement, the EMA may cross over the SMA multiple times in a day.
Note #1: All orders are bracket orders so that if one order executes, it will cancel all other orders.
Note #2: A new order will not be placed by the LFT Buy Program if there is a current order or trade open for a given stock/etf.
Note #3: The LFT Buy Program will not execute more than 3 orders for a given stock/etf unless the LFT Buy Program and Mongod are restarted. Remember to shut down Mongodb first; then shut down LFT Buy Program.
TVIX, VXX, SPXU, FAANG (FB, AAPL, AMZN, NFLX, GOOGL) stocks/etfs
These volatile stocks can be traded daily if you are intelligent and only trade if these stocks/etfs are in a sideways or uptrend. In general, I make make only 3-5 stock/ETF entries in a day only. This is my typical pattern:
About thirty minutes before market opens, I look and see if major stocks are trending up or down in premarket trading. See also https://www.investing.com/equities/trending-stocks
If major stocks or ETFs (such as AAPL and SPY) are trending down, then I set the LFT Buy Program, if all parameters are met, to make entry trades on TXIX, VXX, and SPXU usually within one hour of the market opening (Note: Unless a holiday, the market will open at 9:30am EST. Often, there will a lot of pre-market buying and then a brief time of sell off just after after the market opens so it may be ideal to wait until 10-10:30am to start the LFT Buy Program).
If major stocks like AAPL, AMZN, TWTR, FB are going up in pre-market trading, I trade those stocks. One could also just buy SPY but that ETF is usually less volatile than individual FAANG stocks. If I’m short on time before market opens, I use 1.2x ATR to set the stop loss value and 2x stop loss value to get the take profit.
If I decide to hold for longer periods, I select much bigger TS and TPs than with day trading and choose less volatile stocks. I also like TWTR or MU because it has a lot of volatility but is low cost in comparison to FAANG stocks.

Fibonacci and LFT Buy Long-Term (14 days or more) Parameters for Stocks or ETFs
While in some respects it is riskier to hold stocks or ETFs long term rather than day trading, a longer term trading of stocks is likely to be more profitable and perhaps safer if performed with a solid trading strategy in place.
There are few guidelines for buying stocks that are essential to follow:
1) The Stock or ETF must be in an uptrend to buy effectively. An uptrend simply means that the highs of a stock are getting higher and that the lows are getting higher. A stock or ETF that has begun a downtrend or still in a downtrend should be avoided. It is really key to remember your timeframe here; a stock or ETF may be a recent 2-week downtrend (or pull back), but the stock may still be in an uptrend over the next 2-3 months.
2) On a 30-minute chart, the 20 day SMA (Simple Moving Average) should be crossing or have crossed the 50 day SMA. This is simplest guideline for deciding whether to begin trading.
3) There are a few rare times to buy the stock is at its very bottom (and still down trending), but one should commit only a small percentage of investment capital at this time. If the stock moves lower, you may miss out on a really good buy or end up hitting your stop loss.
4) The key is to buy at or near the bottom (the lowest price) possible, but only buy when the stock price has started its upward migration and then sell only when the target as close as possible to your target.
The above rules are simple in concept to follow but difficult in practice. Psychology and emotions can get in the way of our desire to effectively buy financial instruments, but the true masters execute stock trades with cold-blooded precision. Sticking to Fibonacci calculations and using the LFT Buy Program can help refine one’s consistency in trading and ultimately profitability.
Fibonacci Retracements and Extensions
In conjunction with the LFT Buy Program, it is key to use Fibonacci calculations to help enter and exit trades.
This is a great article worth reading to better understand Fibonacci calculations.
Fibonacci lines can be easily drawn on the TWS of Interactive Brokers. However, when TWS is not available, or a trader needs a quicker calculation, the following can be utilized.
Simple Long-Term Fibonacci Calculation
1) Take the swing high of the past several months. For example, look at the SPXU chart. The swing high is 57.55.
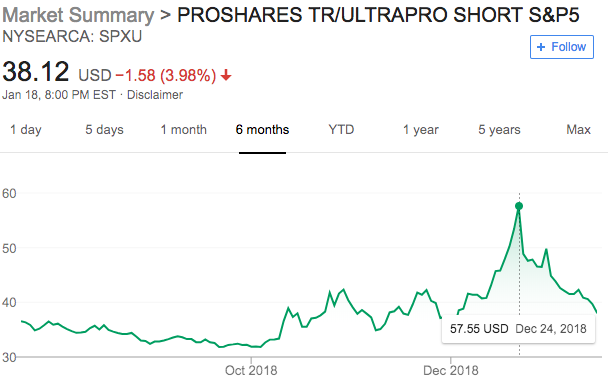
2) Note that the ETF is in a long-term uptrend since mid-October 2018.
3) Key Fibonacci ratios are 23.6%, 38.2% and 61.8%. A simple way to calculate the first Fibonacci retracement is to multiply the swing high 57.55 x .764 = 43.9 (That’s the 23.6% retracement). The next, more common Fibonacci retracement based on the number Phi is calculated by multiplying 57.55 x .618 = 35.5 (the 38.2% retracement). (Note: For double leveraged stocks or ETFs such as TVIX, I will multiple the swing high by .75 and then use that new number to calculate Fibonacci retracements).
4) I like to use the two prices calculated above as a range for when to start up the LFTBuy Program. If the first Fibonacci retracement is hit at 43.9 and the stock has started an uptrend and the 20-day SMA has crossed the 50 day SMA on a 30 minute chart, I will begin the LFTBuy Program with conservative parameters.
5) Most smart traders will wait to the absolute pullback to 35.5 to begin trading. If the second retracement price is hit at 35.5 and the stock is in an uptrend, I will begin the LFTBuy Program with more aggressive parameters.
6) Finally, if the stock or ETF is still in a downtrend past the first and second Fibonacci ratios, it may go all the down to the 3rd ratio. (In this case, 57.55 x .382 = 21.98). If the price of the SPXU passes the 1st and 2nd ratios, I will not trade it past the 2nd ratio until it reaches the 3rd ratio at 21.98.
7) To calculate a long-term exit, one may use the Fibonacci extensions calculation to determine approximately where to exit. Key Fibonacci extension levels are 161.8%, 261.8% and 423.6%.
In the case of SPXU, if the entry price happens to be 37.2, the first Fibonacci extension level is 161.8, or 37.2 x 1.618 = 60.18. If the entry price reaches this level, I will begin aggressively monitoring the stock or ETF with the LFT Buy Program for an exit soon if any pullback occurs. The 161.8% value is a good place to initially set up for an exit.
8) However, since we do not always know if a stock or ETF has begun a downtrend and is simple retracing to its 1st Fibonacci ratio (0.236%), I will bring the trailing stop to breakeven if the stock or ETF, in this case, SPXU, retraces to that level (37.2 x 1.236 = 45.97). If the stock continues in an uptrend, I will continue to hold the stock until either the 2nd Fibonacci retracement (37.2 x 1.382 = 51.41) or the 1st Fibonacci extension (37.2 x 1.618 = 60.18).

LFT Buy Program Long Term Parameters
In theory, one does not need to use LFT Buy Program for long-term trading if you are confident and precise in your assessment of a given stock’s trend as well as place of entry and exit orders for that stock. Unfortunately, unless you are one of the few traders who are really good, and really good all the time, you will likely make a bad trade…at least once, which could cost you a fortune. The LFT Buy Program is designed to help you enter and exit a trade when all the above guidelines and Fibonacci calculations are met but also when the chart indicates that the stock is just beginning to trend one direction or another. The LFT Buy Program allows you to step back away from a stock’s price chart and only enter when your parameters have been met. Keep in mind, though, you can set these parameters so that a stock trade will be executed very easily so it is up to you to be as conservative as possible initially.
Symbol: SPXU (for example)
Limit price: 0.01-20.00 This is a positive value of 1 cent to $20.00 below the market price. If the actual stock or ETF price has not reached the Fibonacci retracements, you should set this entry price to close to the Fibonacci value. If you set the Limit Price too low however, you may not get into the trade. However, if you set the limit price too high, you will get in at top of market. If the price is at the Fibonacci retracements, use ATR to calculate a pullback value for the day you decide to trade.
Take Profit: Use Fibonacci extensions to determine
Exit order fill wait time (ms): 25,000,000 milliseconds (6.9 hours)
The market is open from 9:30-4:00 EST (6.5 hours). If you decide to trade during pre or post market hours, you may want to extend this time. (Note: Do not use this exit order wait time to exit trades with this program because it only does stop limit orders that do not always cancel out the other orders).
Entry order fill wait (ms): 19,100,000 (5.3 hours). If you begin trading by 9:30-10:15am EST, then your trade will have most of the day to execute. Keep in mind that the LFT Buy Program will only place 3 orders in one day for a given stock so if set the entry order fill wait time too low, it will execute only 3 orders, and you may miss a price move later in the day.
Quantity: 10-100 (100-400) If you go over 400 shares, many orders will not be filled at the same price. Be careful to stage your trades. I would recommend using less than 10-15% of available funds on your initial trades. You can always buy more shares as the stock begins to trend higher.
Entry Order SMA (5s): 0.03-.1 Every stock is different so one should watch a stock’s SMA over a period of time as calculated by the LFT Buy Program to get an idea of what kind of bounce in the 5s SMA before a stock begins to bounce upward. If you are being very aggressive with your entry, then set this number lower; if more conservative on entry, set this number higher. (Note: Other than the entry limit price, this is perhaps the most important parameter).
Exit Order SMA (9 period SMA): -0.8 to -3 This is really just thought of as an emergency stop loss–in case trade goes against you rapidly. I would set this up for running once you have a profitable trade. You do not want to exit, in general, before your trailing stop or or before your exit price unless day trading.
Trailing Stop: For long term stocks, if you buy in at the 1st Fibonacci retracement, do 2 ATR below the 2nd Fibonacci retracement. (That is, multiply the recent swing high by the .618 and subtract 2 ATR from the daily chart). If you are buying in at the 2nd Fibonacci retracement, subtract 2 ATR below the 3rd Fibonacci retracement. (That is, multiply the recent swing high by the .382 and subtract 2 ATR from the daily chart). Keep in mind what risk tolerance you want to take on with each trade.
MA Crossover Entry: True For long-term trades, keep this “true” because it will help keep you from bad entry. Along with doing Fibonacci calculations, I would also remind you to check the chart and make sure the SMA20 is crossing over the SMA50 on a 30 minute chart before even starting the LFT Buy Program for a long-term trade–This is probably the most important guideline to assess an uptrend for stocks or ETFs.
Finally, just like starting a new business, making a stock trade or trade of any financial instrument is to put money at risk. The above tools of Fibonacci calculations, algorithmic parameters, and entire LFT Buy Program are designed to maximize gains while minimizing risk. However, no computer cares what happens to your money–only you do. As with any business, the key to trading success is in the well-thought out management of your funds in the face of the immediate risks. In sum, trust these above tools to help you minimize risk but keep an active management interest in every live trade you make.